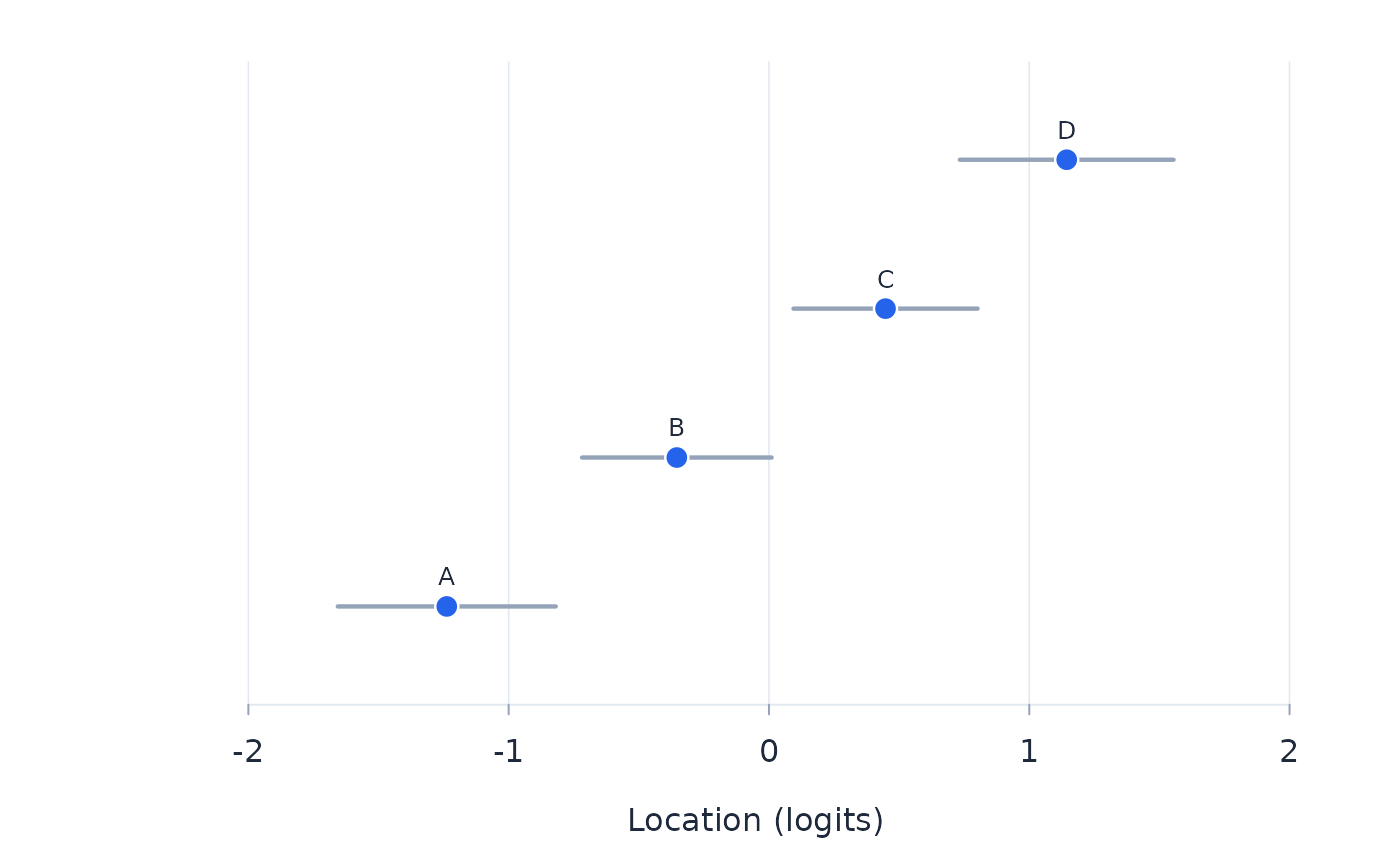
Caterpillar plot of object locations with 95 per cent error bars. The intervals use the reference degrees of freedom carried by the fitted covariance: a t reference for judge-based uncertainty and the limiting normal reference otherwise. An interval is omitted when its covariance does not support inference. Objects beyond the specified fit-residual band are marked.
Arguments
- fit
An object from
btl.- band
Absolute fit-residual value beyond which an object is highlighted.