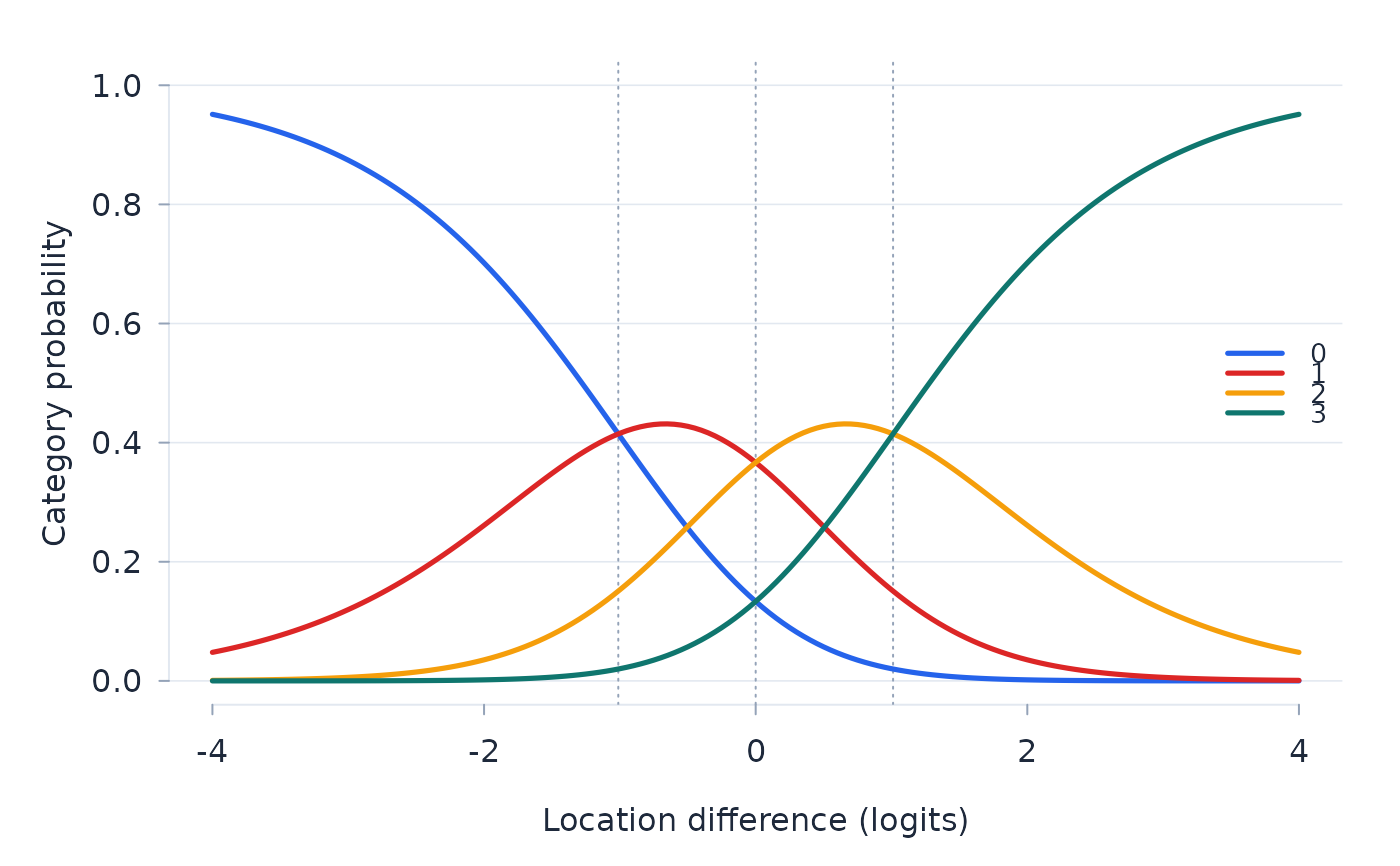
For a polytomous paired-comparison fit, the probability of each response
category as a function of the location difference
beta_a - beta_b, with the symmetric threshold structure marked.
The display is the paired-comparison counterpart of the category
probability curves of a polytomous item.
A fitted position effect is included for object a presented first. For a
history-dependent fit, the horizontal axis is the full linear predictor,
including position and history terms, rather than the object difference alone.
Usage
plot_btl_categories(fit, grid = seq(-4, 4, 0.05))Arguments
- fit
A polytomous fit from
btl(withresponse).- grid
Difference grid, in logits; the full linear-predictor grid for history-dependent fits.
Examples
set.seed(1)
beta <- c(A = -1, B = -0.3, C = 0.4, D = 0.9)
pr <- t(combn(names(beta), 2))
d <- data.frame(a = rep(pr[, 1], each = 40), b = rep(pr[, 2], each = 40))
P <- vapply(seq_len(nrow(d)), function(r)
  item_moments(beta[d$a[r]] - beta[d$b[r]], c(-1, 0, 1))$P, numeric(4))
d$grade <- apply(P, 2, function(p) sample(0:3, 1, prob = p))
plot_btl_categories(btl(d, "a", "b", response = "grade"))