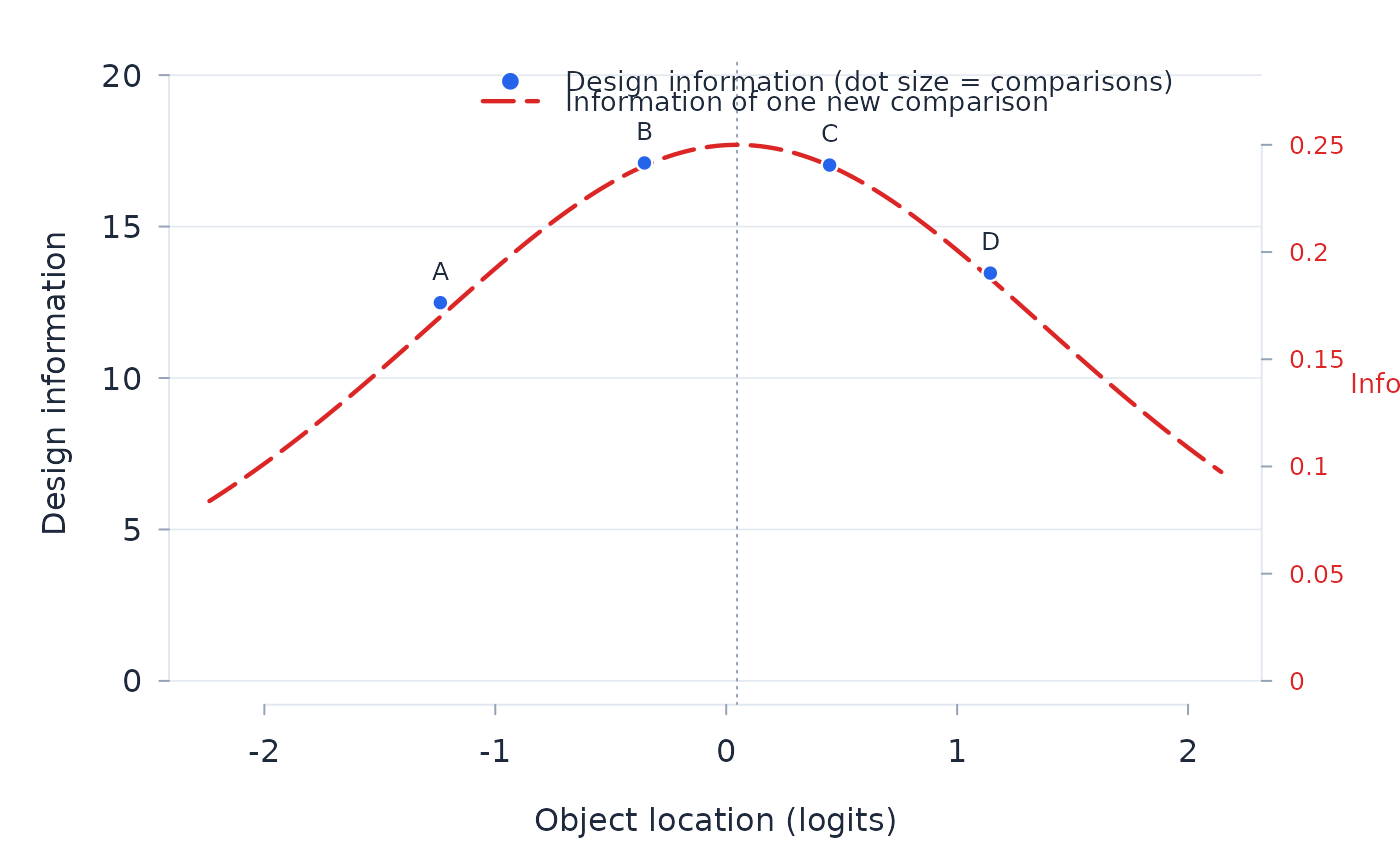
The paired-comparison counterpart of a test-information display. Every object is a dot at its location (x) and its design information (y, the pooled Fisher information of the comparisons it took part in), the dot sized by how many comparisons that is. For an equal-unit fit, a reference curve on the right axis traces the information a single new comparison would carry against an opponent at each location. For a dichotomous fit without a position effect, it peaks at gap zero. Ordered response thresholds and position effects can change where it peaks. A frame fit has no single reference curve because the information also depends on the fitted panel and set units. The reference curve is also omitted for history-dependent fits. With a position effect only, it represents the median-location object presented first against each opponent location.
Arguments
- fit
A paired-comparison fit from
btl.- grid
Optional location grid for the equal-unit reference curve.