
Consistency plot for paired-comparison transitivity
Source:R/btl-independence.R
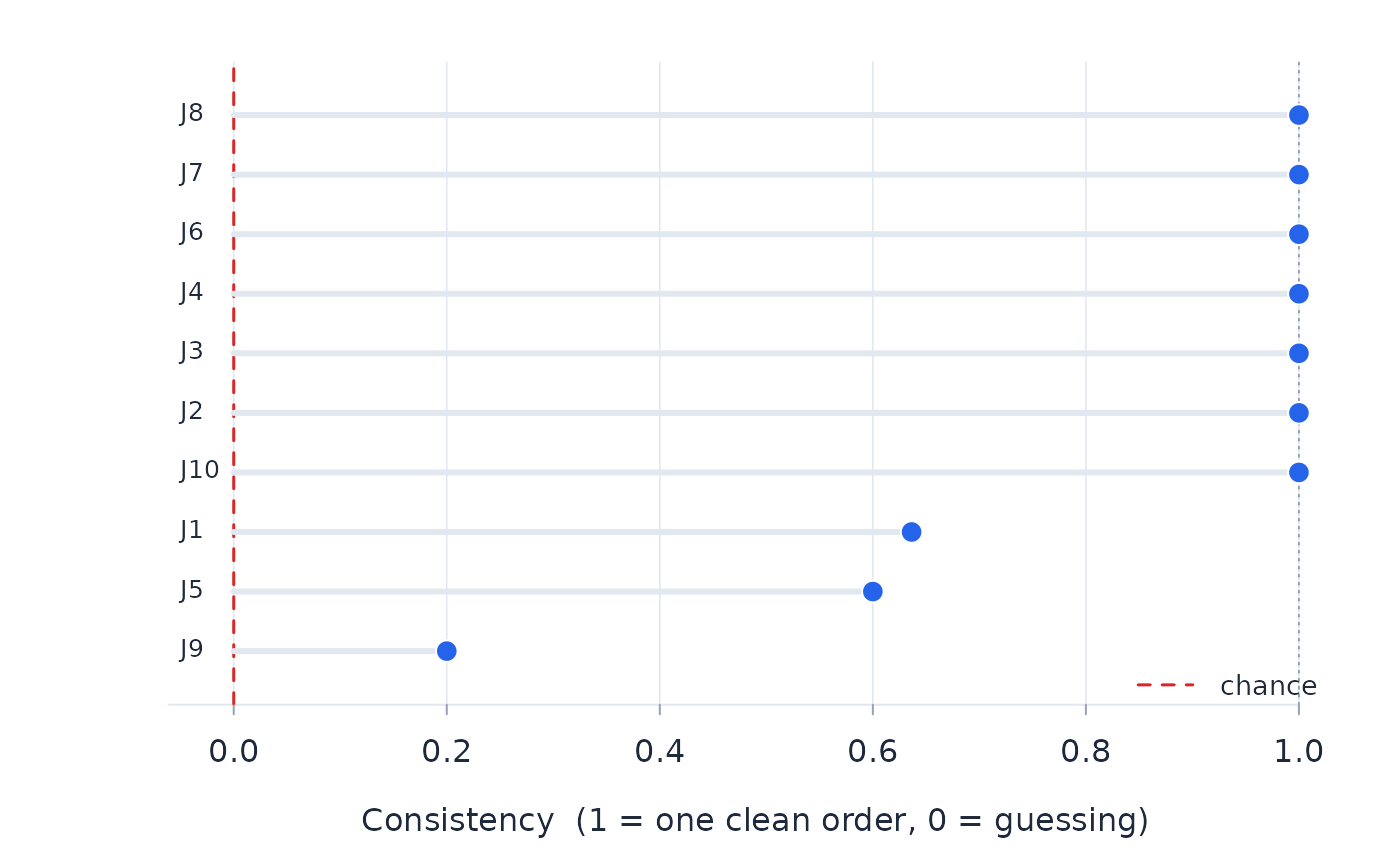
plot_btl_transitivity.RdWith by = "judge" (the default when judges exist), plots each
judge's consistency – one minus the circular-triad rate over the chance
rate – as a dot against the chance line at zero: the individual-judge
lens, a judge-fit analogue. With by = "object", plots each object's
circular-triad involvement instead: the structural lens, showing which
objects sit in the most contradictions.
Usage
plot_btl_transitivity(x, by = c("auto", "judge", "object"), ...)Examples
# \donttest{
d <- simulate_btl(6, 10, reps_per_pair = 20, seed = 1)
fit <- btl(d, "object_a", "object_b", winner = "winner", judge = "judge")
tr <- btl_transitivity(fit)
plot_btl_transitivity(tr)
 # }
# }