Skip to contents

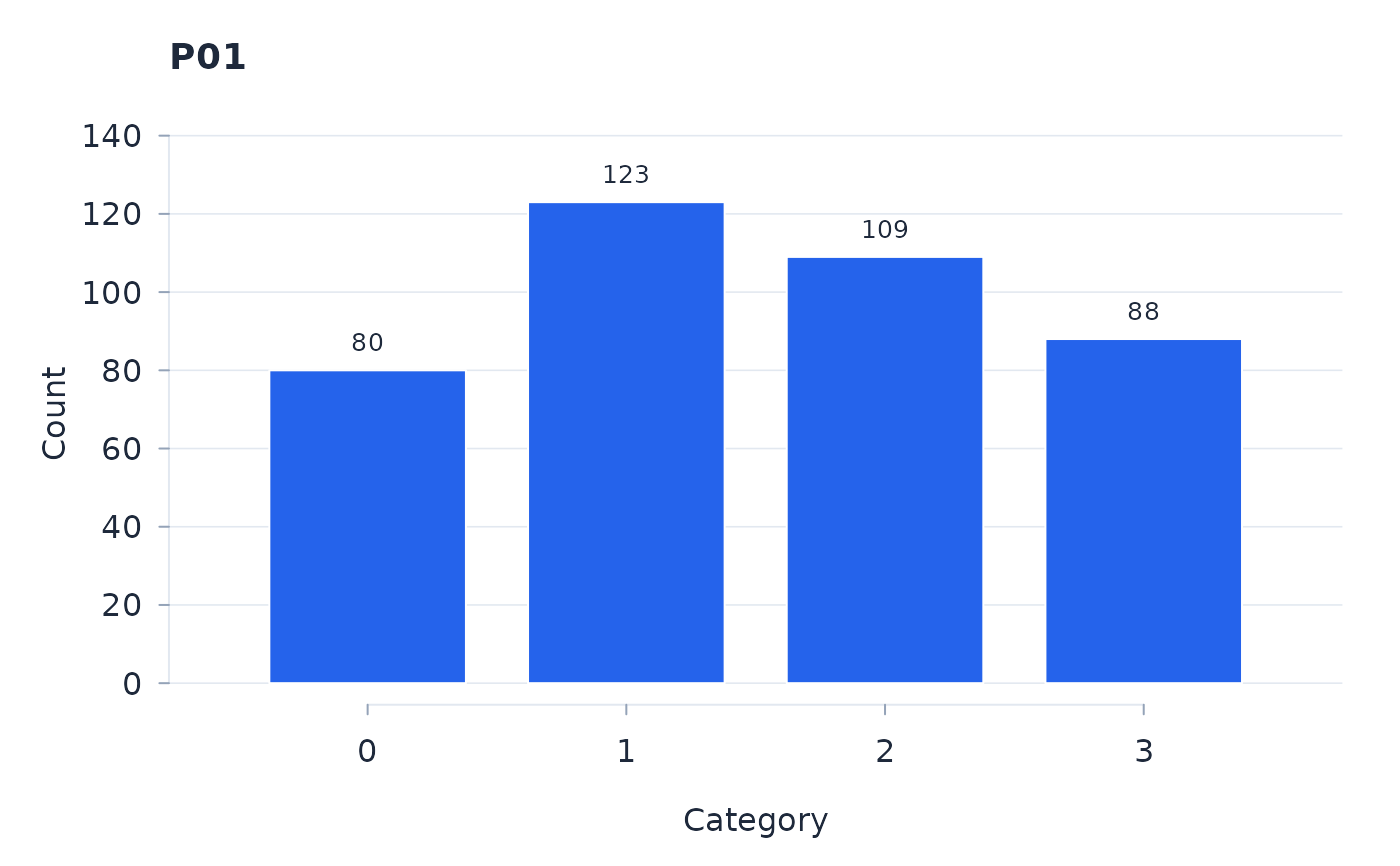
Observed response distribution over the categories of one item.

Usage

plot_catfreq(fit, item)

Arguments

fit

A fitted object from rasch.

item

Item name or column index.

Value

Called for its plotting side effect; invisibly NULL.

Examples

set.seed(1)
simP <- function(th, t) { x <- 0:length(t); p <- exp(x * th - c(0, cumsum(t))); p / sum(p) }
th <- rnorm(400)
X <- sapply(1:4, function(i) sapply(th, function(t) sample(0:3, 1, prob = simP(t, c(-1, 0, 1)))))
colnames(X) <- sprintf("P%02d", 1:4)
plot_catfreq(rasch(X), "P01")