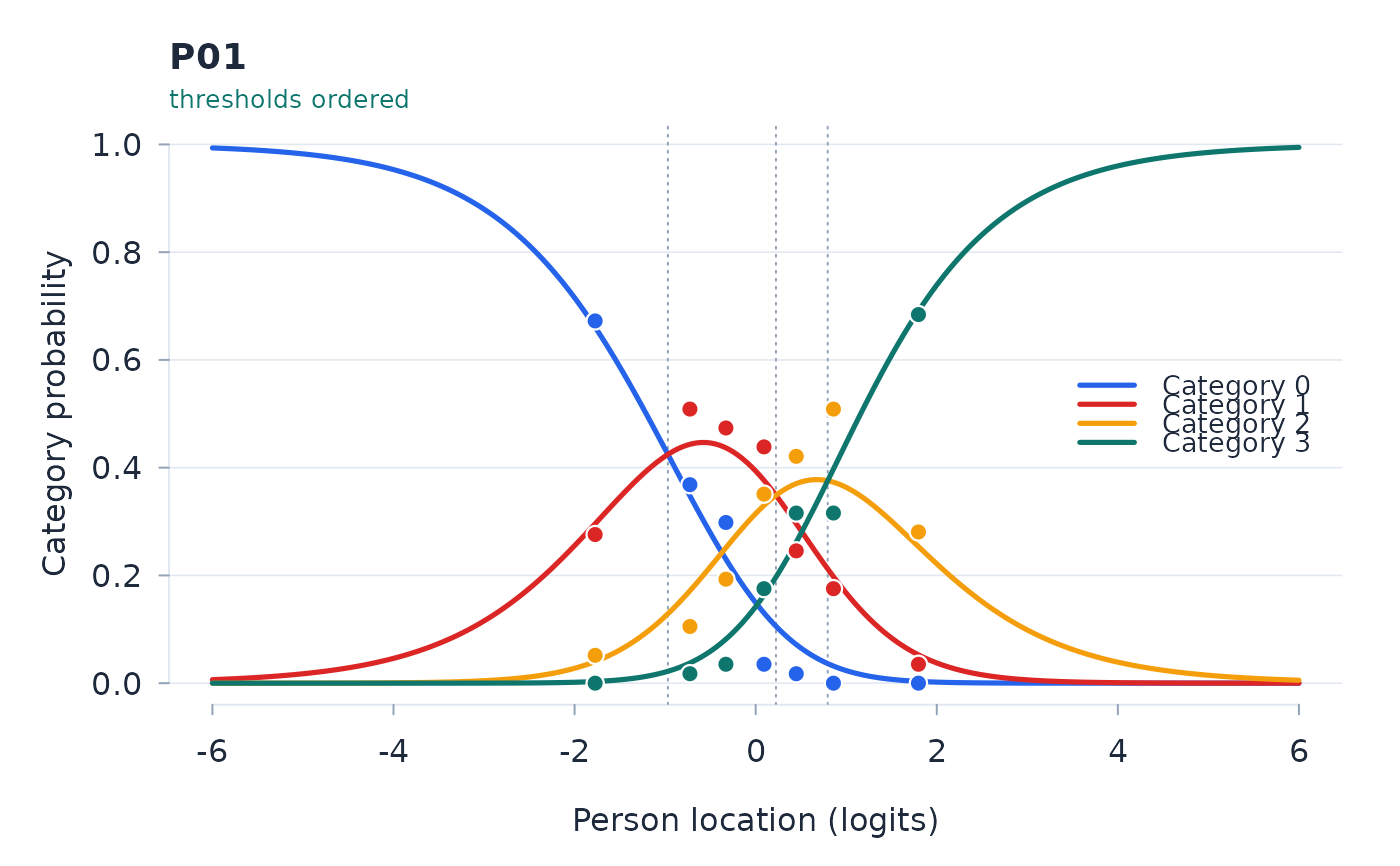
Plot category probability curves
Usage
plot_ccc(fit, item, grid = NULL, observed = FALSE, n_groups = NULL)
Arguments
- fit
A fitted object from rasch.
- item
Item name or column index.
- grid
Logit grid over which to draw the curves.
- observed
Whether to add category proportions by class interval
(Andrich and Marais 2019, ch. 20).
- n_groups
Class intervals for the observed points; by default the
fit's own allocation for this item, so the points match the item-trait
test they illustrate.
Value
Called for its plotting side effect; invisibly NULL.
Examples
set.seed(1)
simP <- function(th, t) { x <- 0:length(t); p <- exp(x * th - c(0, cumsum(t))); p / sum(p) }
th <- rnorm(400)
X <- sapply(1:4, function(i)
  sapply(th, function(t)
    sample(0:3, 1, prob = simP(t, c(-1, 0, 1)))))
colnames(X) <- sprintf("P%02d", 1:4)
plot_ccc(rasch(X), "P01", observed = TRUE)