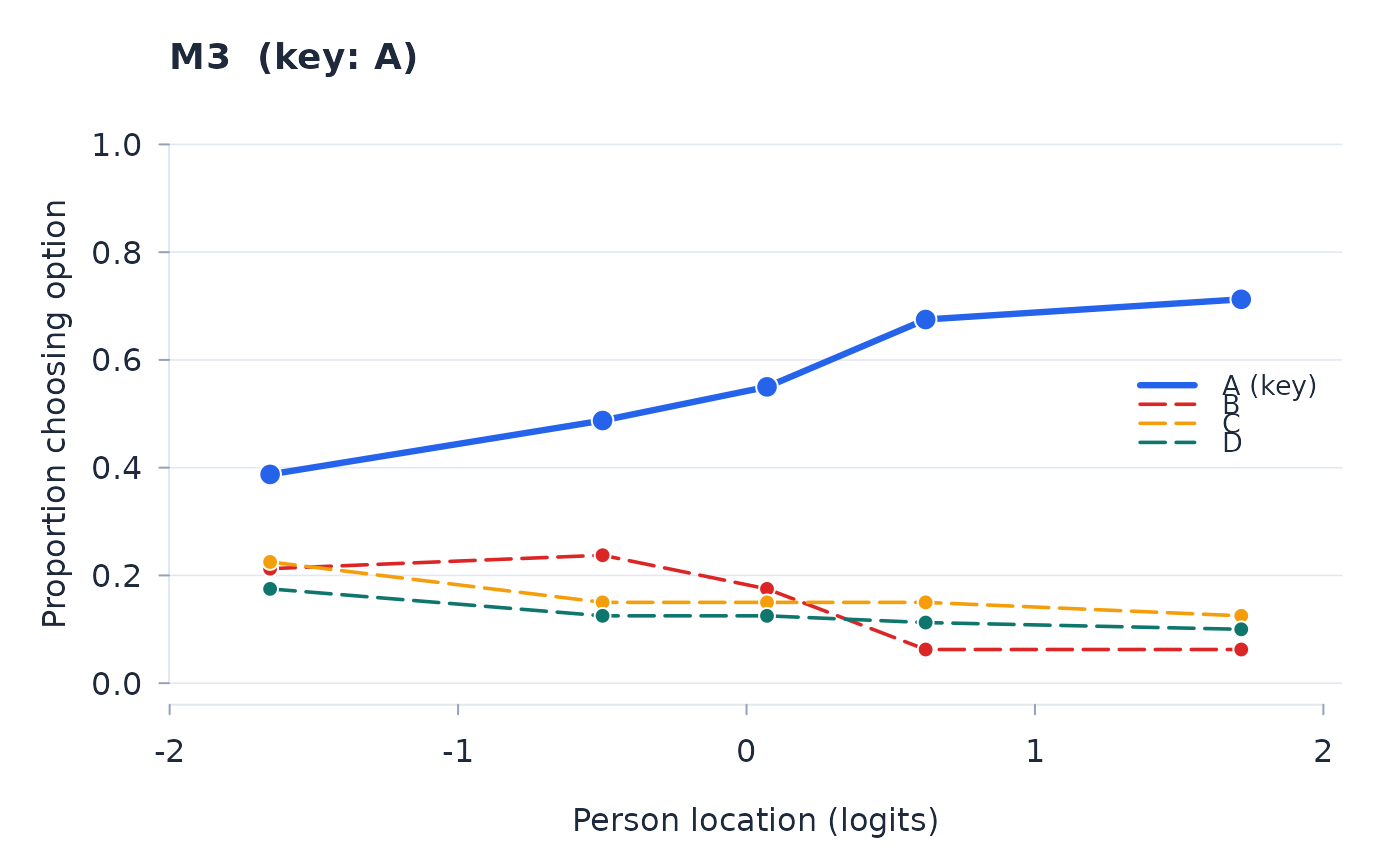
The proportion choosing each response option across class intervals of the rest measure (the person estimate from the other items), with the keyed option drawn solid and bold. The curves are descriptive. Under ordered option scoring, higher-scored options should tend to occur at higher rest measures; an intermediate-credit option may peak in the middle.
Arguments
- fit
A fitted object from
raschrun with akey.- item
Keyed item name.
- n_groups
Number of class intervals. By default, use the fit's count, with at least two requested intervals. Tied locations may produce fewer intervals.
Examples
set.seed(1); Np <- 400
th <- rnorm(Np)
raw <- sapply(seq(-1, 1, length.out = 6), function(d) {
  ok <- rbinom(Np, 1, plogis(th - d))
  ifelse(ok == 1, "A", sample(c("B", "C", "D"), Np, replace = TRUE))
})
colnames(raw) <- paste0("M", 1:6)
fit <- rasch(raw, key = setNames(rep("A", 6), colnames(raw)))
plot_distractors(fit, "M3")