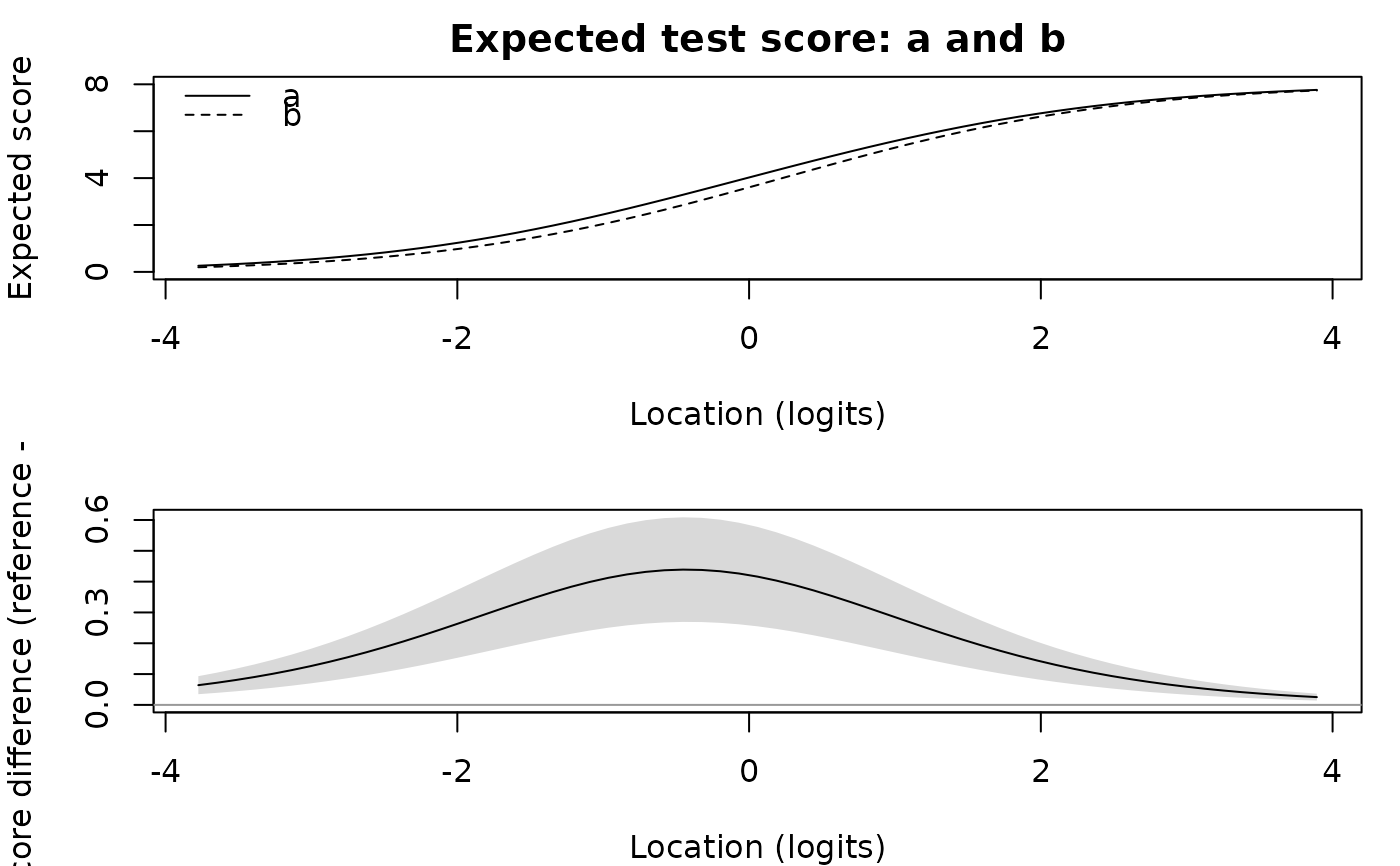
Draws the expected-score curves of the reference and one other group over the location scale, with the difference between them below.
Examples
set.seed(2)
n <- 400
d <- seq(-1.5, 1.5, length.out = 8)
g <- rep(c("a", "b"), each = n / 2)
sh <- matrix(0, n, 8); sh[g == "b", 2:3] <- 0.8
X <- matrix(rbinom(n * 8, 1, plogis(outer(rnorm(n), d, "-") - sh)), n, 8)
colnames(X) <- paste0("I", 1:8)
fit <- rasch(data.frame(X, grp = g), factors = "grp")
plot_dtf(dtf(fit, by = "grp", items = c("I2", "I3")))