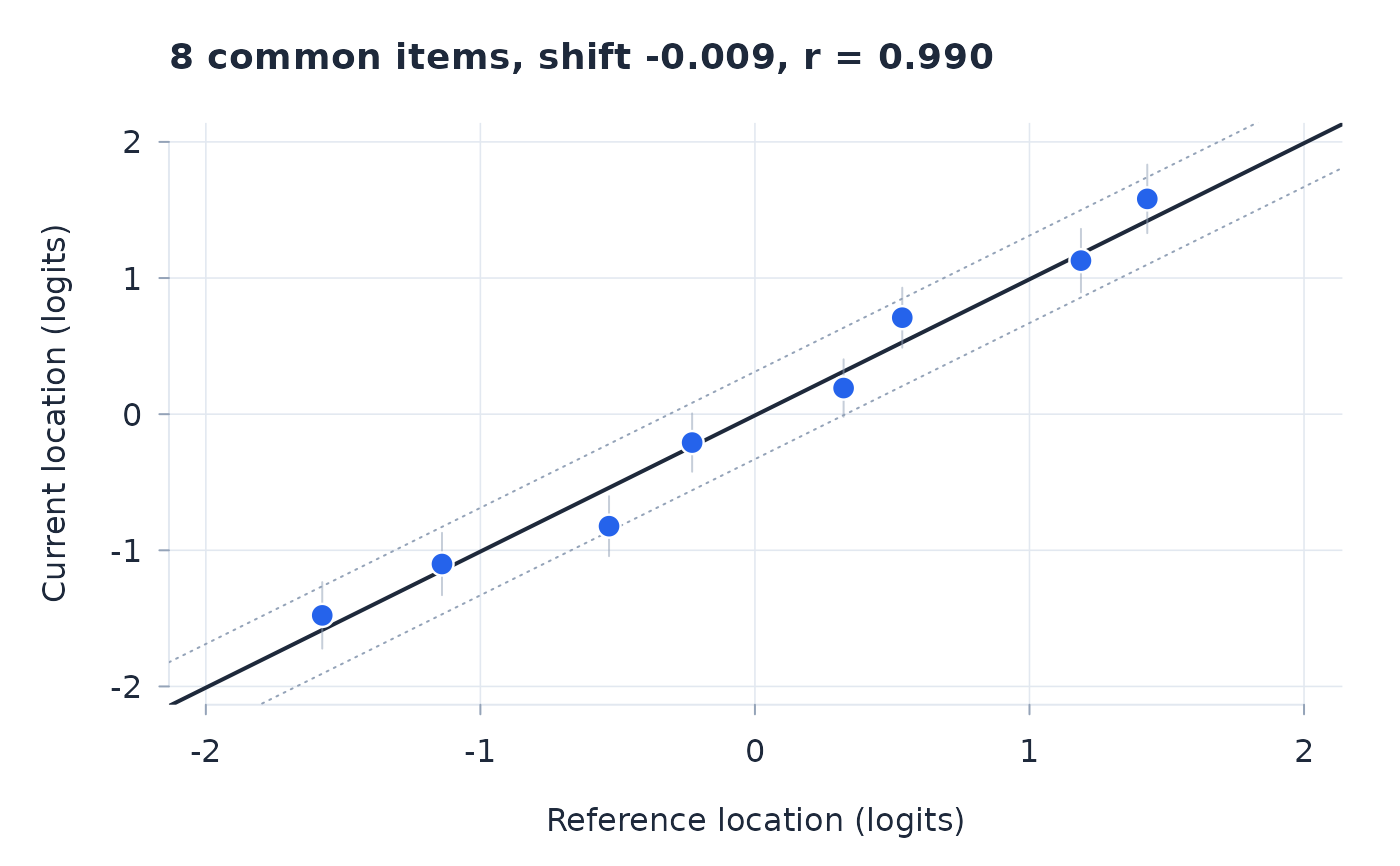
Scatter of the two calibrations' common-item locations with the shifted identity line, per-item 95 per cent contrast intervals, and a dotted guide band at their average half-width; drifting items (Holm-adjusted) are highlighted and labelled.
Usage
plot_equate(fit, reference, shift = c("mean", "none"), independent = NULL)Arguments
- fit
A fitted object from
rasch.- reference
A second
raschfit, or a data frame with columnsitem,location, and optionallyse; a polytomous bank also needsmax.- shift
Passed to
equate_tests.- independent
Passed to
equate_tests.
Value
Called for its plotting side effect; invisibly the
equate_tests result.