
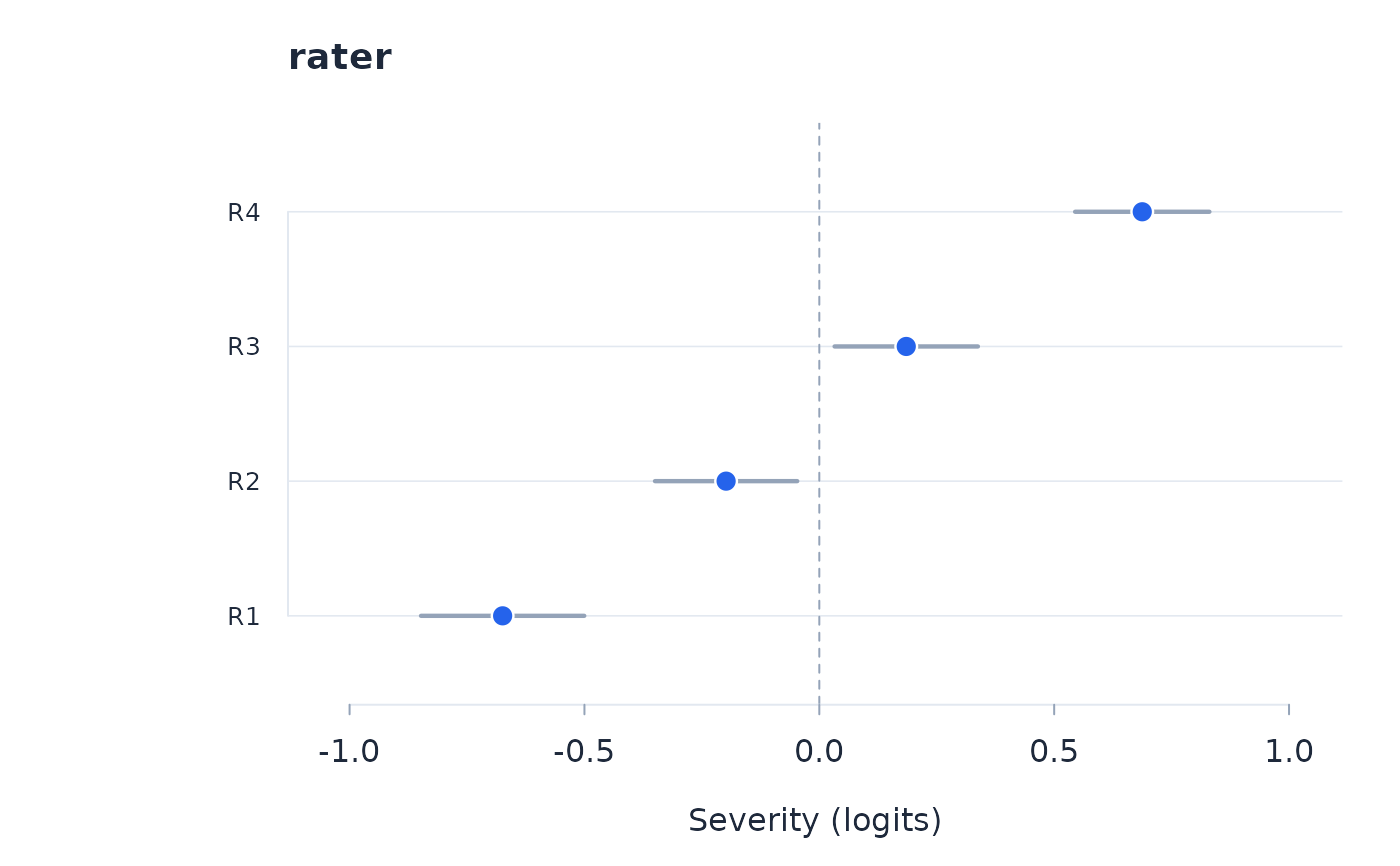
Caterpillar plot of the severity of each level of a facet from a many-facet analysis, with 95 per cent error bars; levels with pooled fit residuals beyond the band are highlighted.
Arguments
- fit
A fitted object from
rasch_mfrm.- facet
Facet name; defaults to the first facet.
- band
Fit residual band beyond which a level is highlighted.
Examples
# \donttest{
set.seed(1)
simP <- function(th, tau) {
x <- 0:length(tau)
p <- exp(x * th - c(0, cumsum(tau)))
p / sum(p)
}
persons <- sprintf("P%03d", 1:120); raters <- paste0("R", 1:4)
th <- setNames(rnorm(120, 0, 1.3), persons)
rho <- setNames(c(-0.6, -0.2, 0.2, 0.6), raters)
tau <- list(A = c(-1, 1), B = c(-0.5, 1.2), C = c(-1.2, 0.4))
d <- expand.grid(person = persons, item = names(tau), rater = raters,
stringsAsFactors = FALSE)
d$score <- mapply(function(p, i, r)
sample(0:2, 1, prob = simP(th[p], tau[[i]] + rho[r])),
d$person, d$item, d$rater)
plot_facets(rasch_mfrm(d, "person", "item", "score", facets = "rater"))
 # }
# }