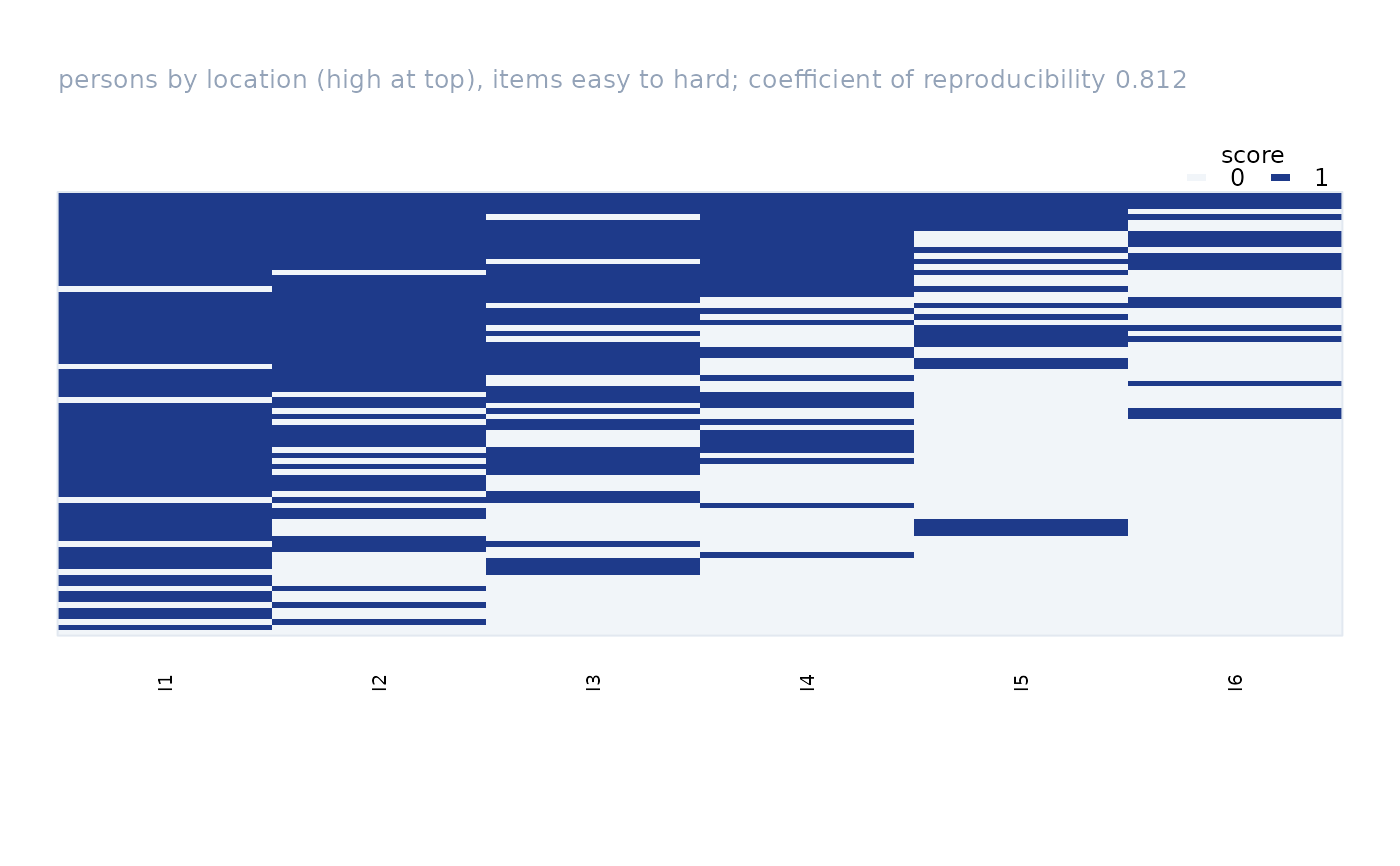
Displays the dichotomous Guttman-ordered response matrix as a heatmap (dark for a score of one), with persons sorted by location down the rows and items by location across the columns. The coefficient of reproducibility is shown in the subtitle.
Arguments
- fit
A fitted object from
rasch.- max_persons
Persons are thinned to at most this many evenly spaced rows for legibility on large samples.