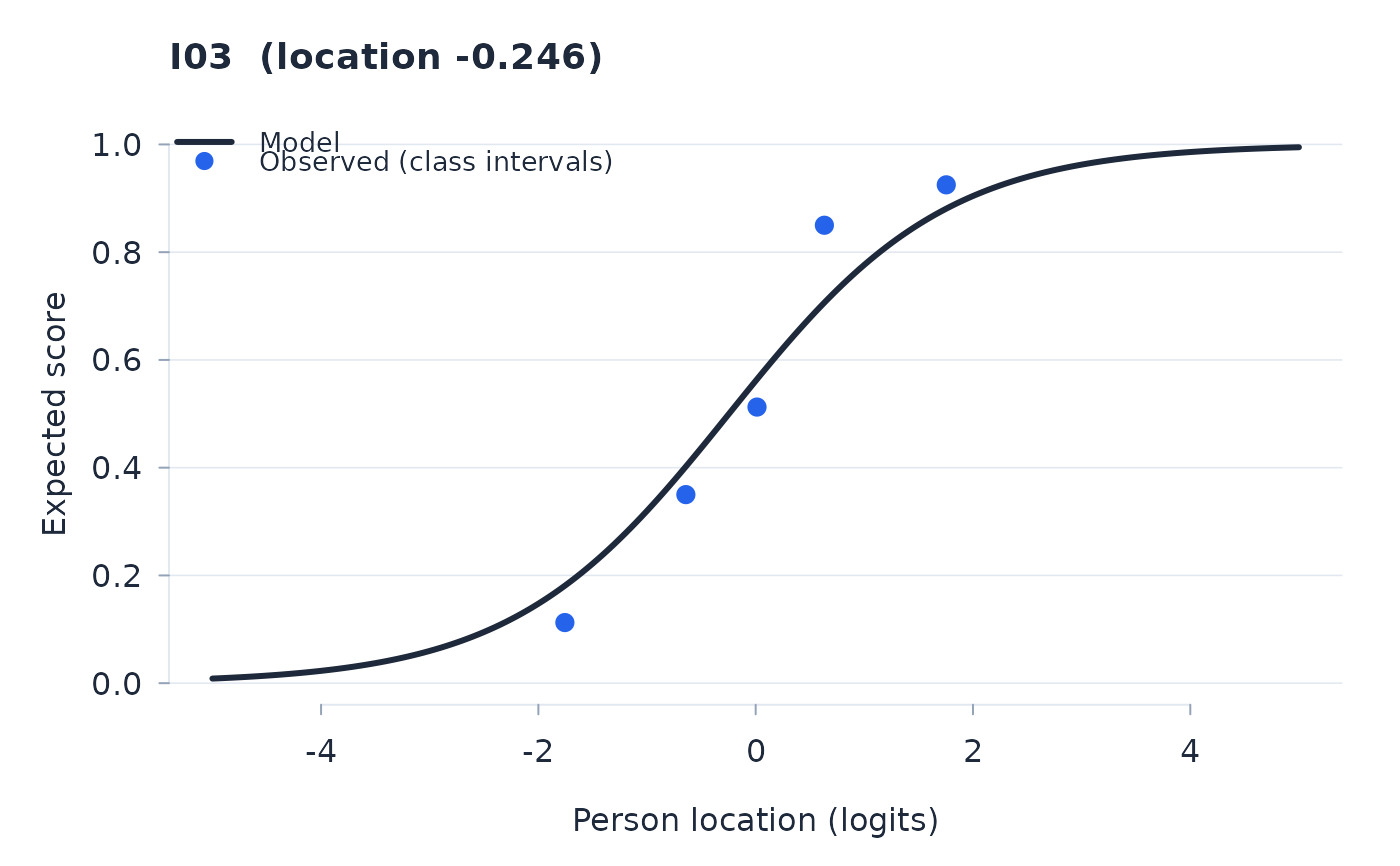
Draws the model expected-score curve with observed class-interval means
overlaid. Several items may be drawn together; their expected scores are
then expressed as proportions of their maximum scores. With group
supplied, observed means are drawn separately per group, the conventional
graphical DIF display. For an MFRM fit, a single item may be named; its
observed item-by-facet response cells are aligned by their fitted facet and
interaction shifts before the class-interval means are formed.
Arguments
- fit
A fitted object from
rasch.- item
One or more item names or column indices. Up to eight items may be overlaid. A group overlay requires a single item.
- group
Optional person grouping vector, or one or more names of factors nominated in the fit, for a DIF overlay; several names give the factor-combination cells (the factorial display).
- n_groups
Number of class intervals for the observed means; by default the fit's own count, or – with a
groupoverlay – a count adapted to keep the smallest group's interval cells adequately filled.- grid
Logit grid over which to draw the model curve.
- observed
Whether to add observed class-interval means.