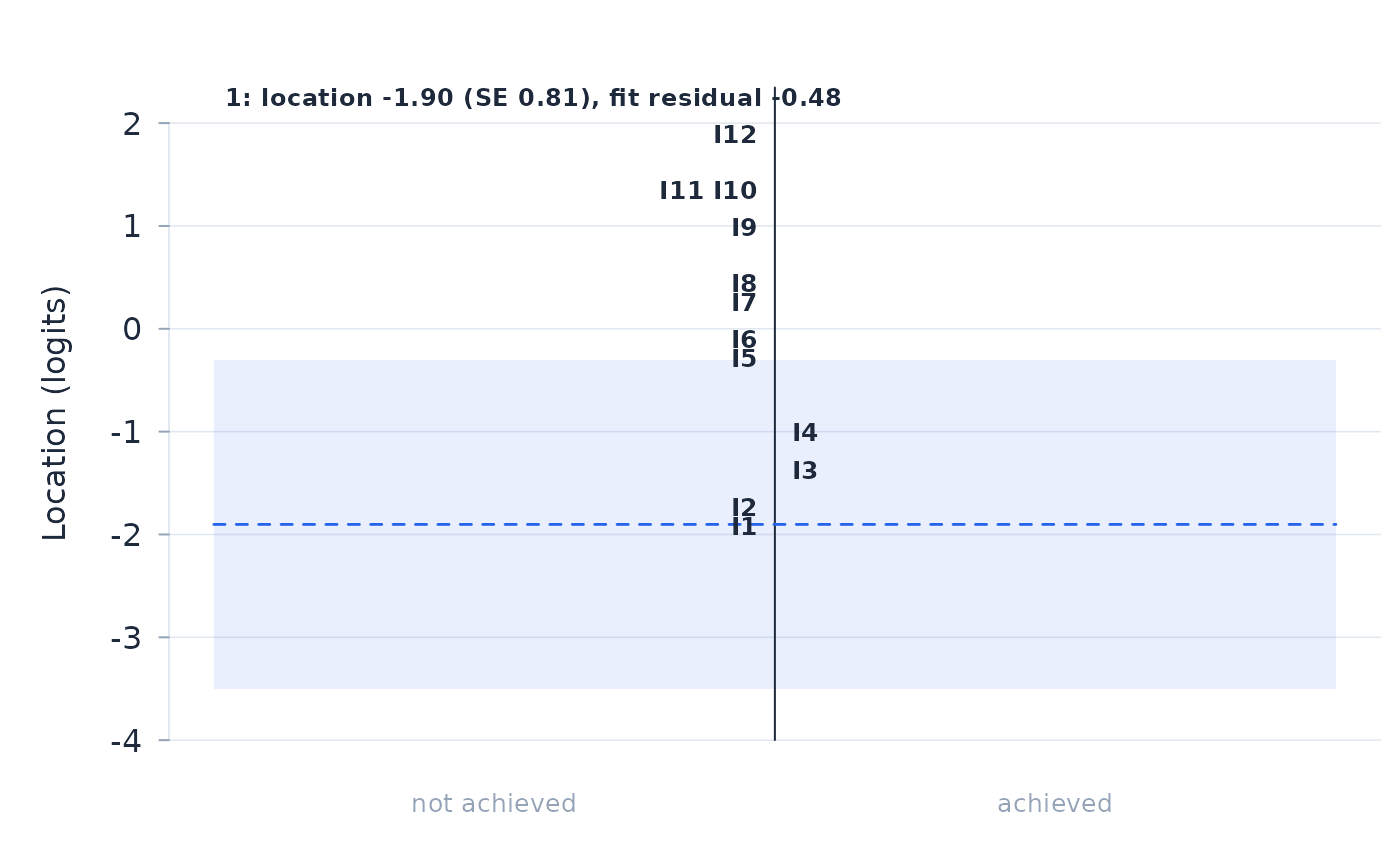
The person diagnostic map (Wright, Mead and Ludlow 1980): item thresholds the person achieved to the right of a vertical logit axis and thresholds not achieved to the left, with the person's location drawn as a dashed line inside its confidence band. Achieved thresholds above the band (unexpected successes) and unachieved thresholds below it (unexpected failures) are highlighted; a clean response pattern shows achieved thresholds below the band and unachieved ones above it.
Arguments
- fit
A fitted object from
rasch.- person
Row number of the person, or an ID matching
fit$person$id.- level
Confidence level of the band around the person location used to mark unexpected responses. The selected person must have a positive, finite standard error; without it the band and the unexpected-response classification are unavailable.
- bins
Number of vertical bins used to stack the threshold labels.
- xlim
Optional logit range; thresholds outside it are omitted.
- cex_labels
Character expansion for the threshold labels.