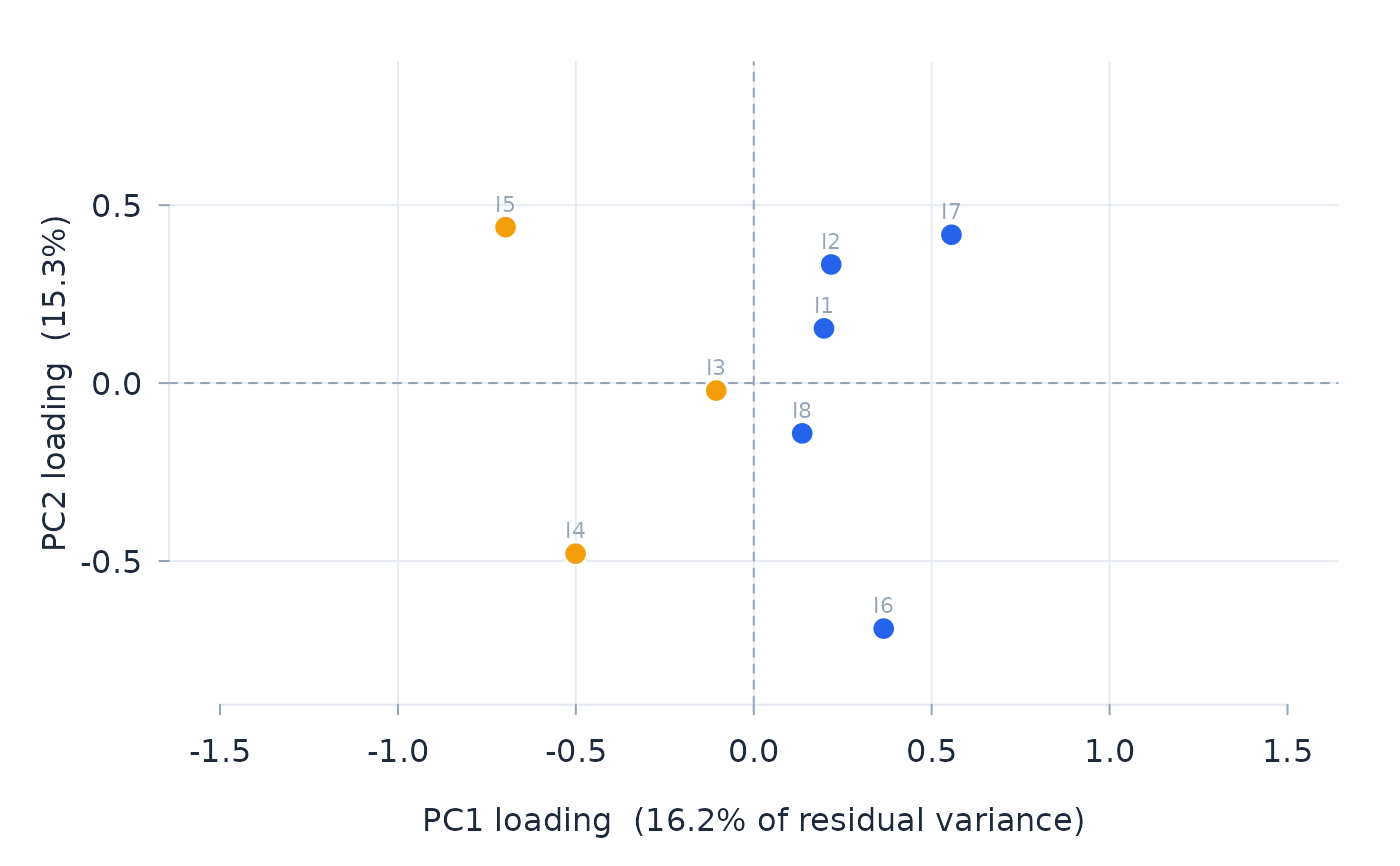
Item loadings on the first two residual principal components – the pair that usually carries any interpretable second dimension – plotted against one another on equal (isometric) axes. Items far from the origin with opposing signs on PC1 mark a possible contrast, and PC2 separates them further. Point colour follows the sign of the PC1 loading, the split the unidimensionality t-test uses by default.
Arguments
- fit
A fitted object from
rasch.