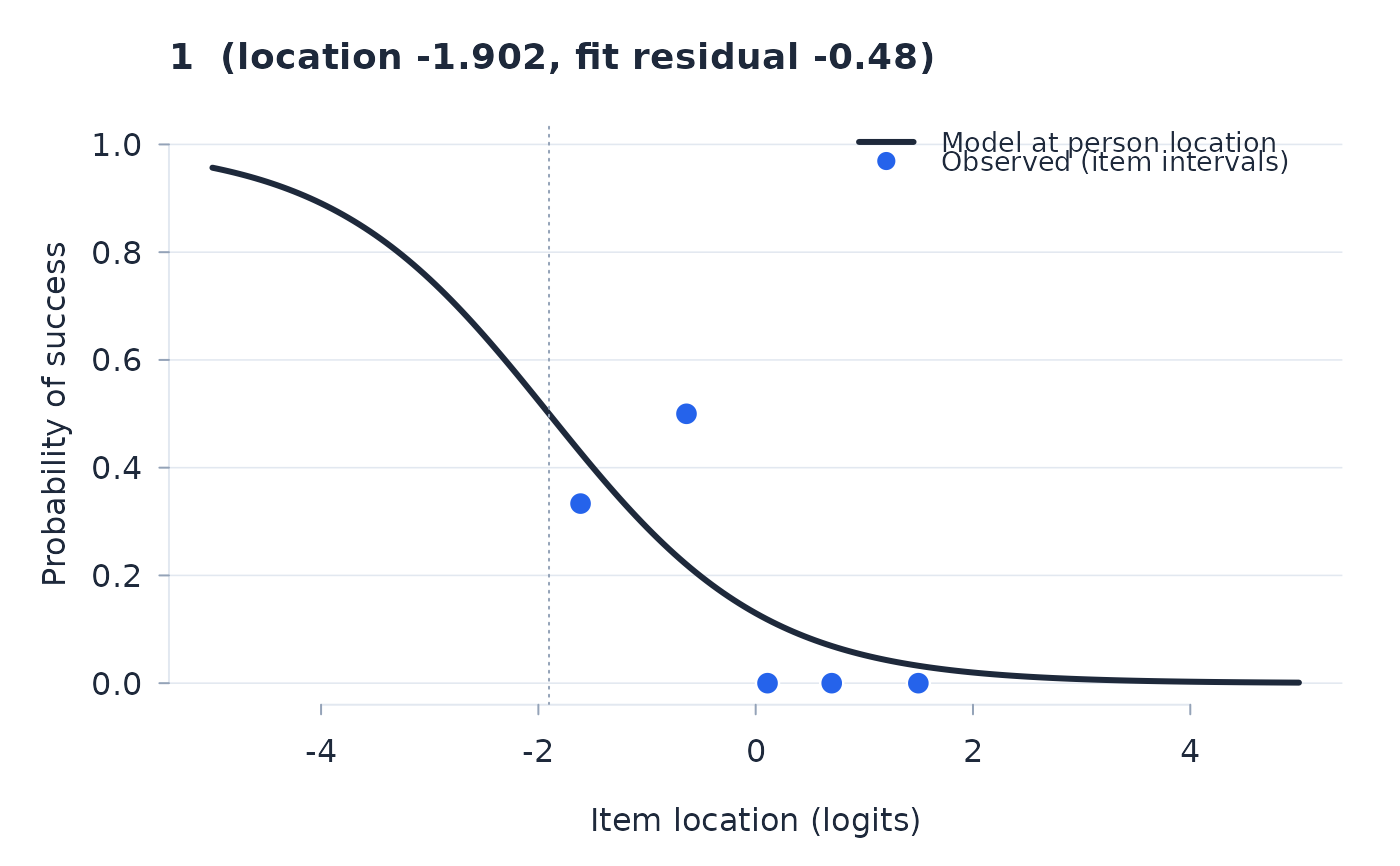
The person characteristic curve: the modelled expectation at the person's estimated measure against item location, with the person's observed responses overlaid, grouped into item-difficulty intervals (proportion of maximum score per interval). A wholly dichotomous unit-discrimination fit draws the exact logistic curve. Polytomous, rating scale, many-facet, and frame fits have no single curve in the item location alone, so the model is displayed as its expected proportion of maximum for the actual items within each interval, under the fitted thresholds, response cells, and frame units. Erratic responding (for example lucky guessing on hard items by a low-proficiency person) shows as observed points far from the model, complementing the person fit residual.
Arguments
- fit
A fitted object from
rasch.- person
Row number of the person, or an ID matching
fit$person$id.- n_groups
Number of item-difficulty intervals for the observed points (capped by the number of observed items).
- grid
Item-location grid over which the dichotomous curve is drawn; interval displays ignore it.