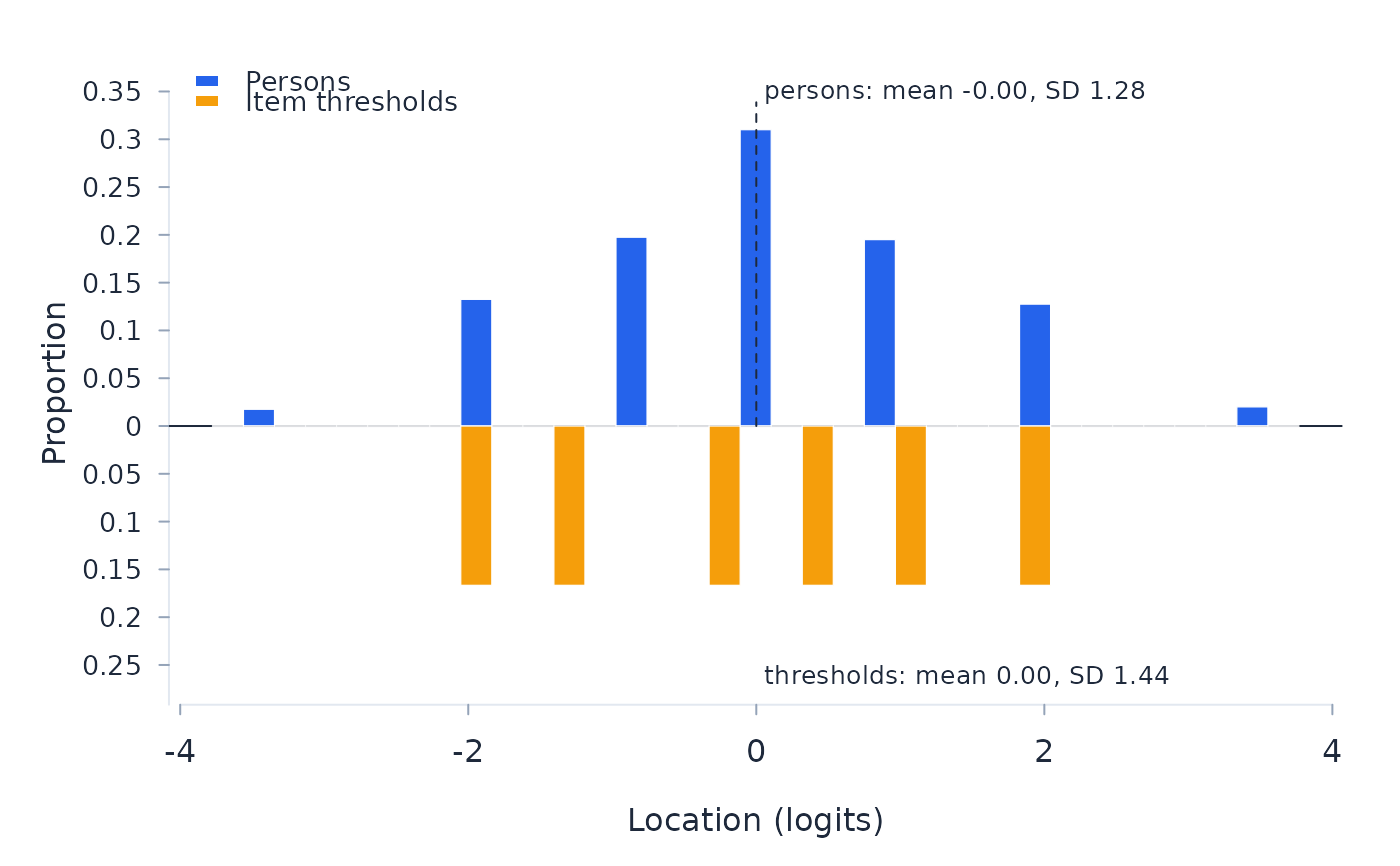
The targeting display: the person location distribution above the axis and the calibration threshold distribution mirrored below it, on a shared logit scale. Dashed lines mark the person and threshold means in their distributions' colours. MFRM and EFRM thresholds belong to response cells.
Arguments
- fit
A fitted object from
rasch.- bins
Number of histogram bins.
- xlim
Optional logit range for the shared scale; persons and thresholds outside it are omitted. By default the range is extended to labelled tick marks beyond the most extreme plotted estimate.
- information
Whether to overlay the test information function on a separate right-hand axis. Fits with more than one administrable design receive one curve per design.
- group
Optional person-group level: one level of a fitted person factor, restricting the person distribution to those persons. A level no fitted factor carries is an error.
- items
Optional item selection restricting the threshold distribution: item names, or one item-set name of an extended-frame fit, whose virtual item-by-group cells match through their underlying items. The selection is named in the legend, so a restricted map cannot be read as the whole instrument. The information curve follows the same item selection; for an extended-frame fit it also follows the response cells occupied by the selected person group. For EFRM and MFRM, only response patterns present in that person group are shown.