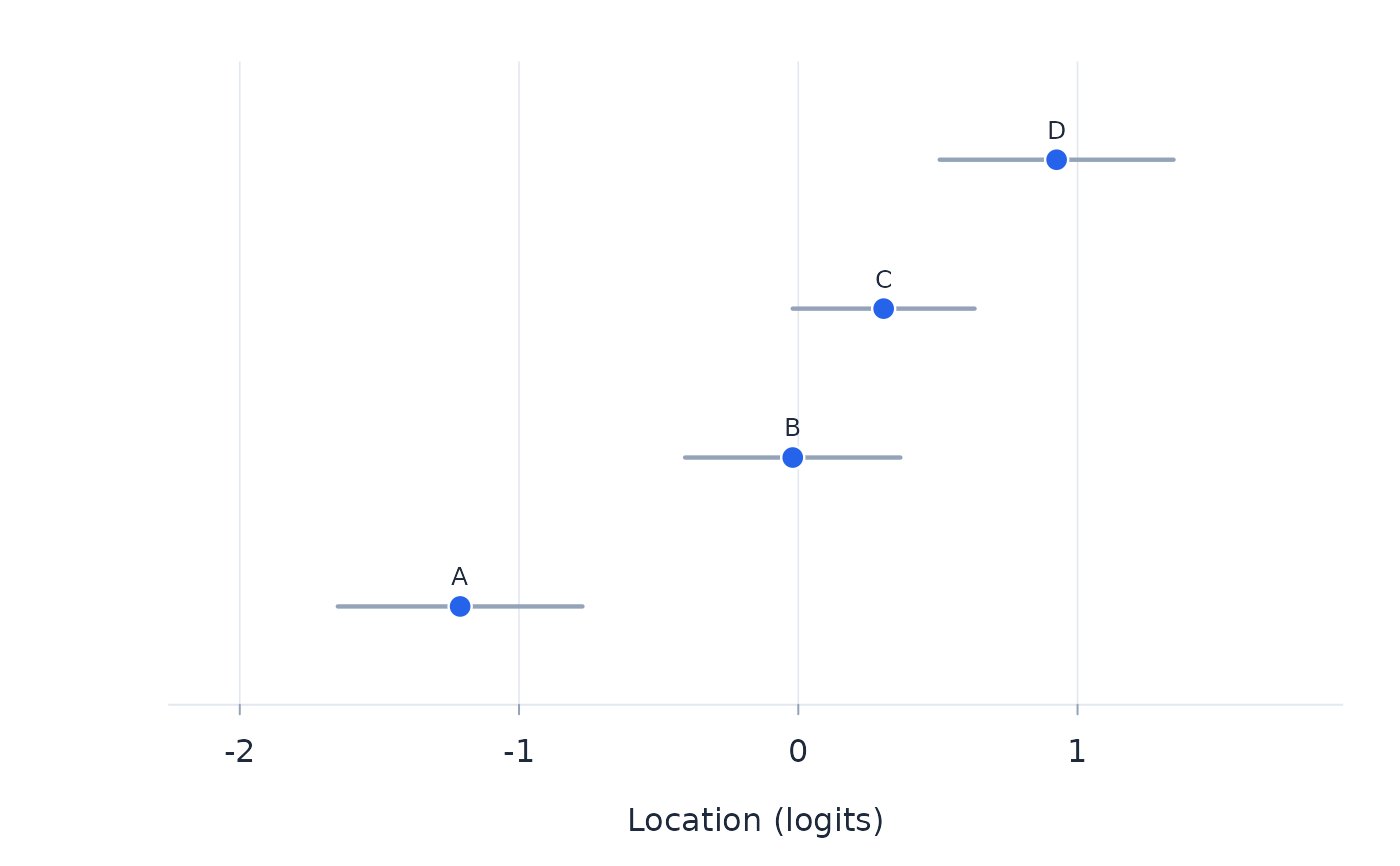
Caterpillar plot of the object locations with 95 per cent error bars, the objects beyond the fit-residual band marked and extreme objects shown without an interval. The interval uses a t reference with judges minus one degrees of freedom for judge-clustered errors and the normal reference otherwise.
Arguments
- fit
An object from
pl.- band
Absolute fit-residual value beyond which an object is highlighted.
Examples
set.seed(1)
beta <- c(A = -1, B = -0.3, C = 0.4, D = 0.9)
rk <- do.call(rbind, lapply(1:40, function(r) {
  rem <- names(beta); ord <- character(0)
  while (length(rem) > 1) {
    pick <- sample(rem, 1, prob = exp(beta[rem]))
    ord <- c(ord, pick); rem <- setdiff(rem, pick)
  }
  data.frame(ranking = r, object = c(ord, rem), rank = 1:4)
}))
plot_pl(pl(rk))