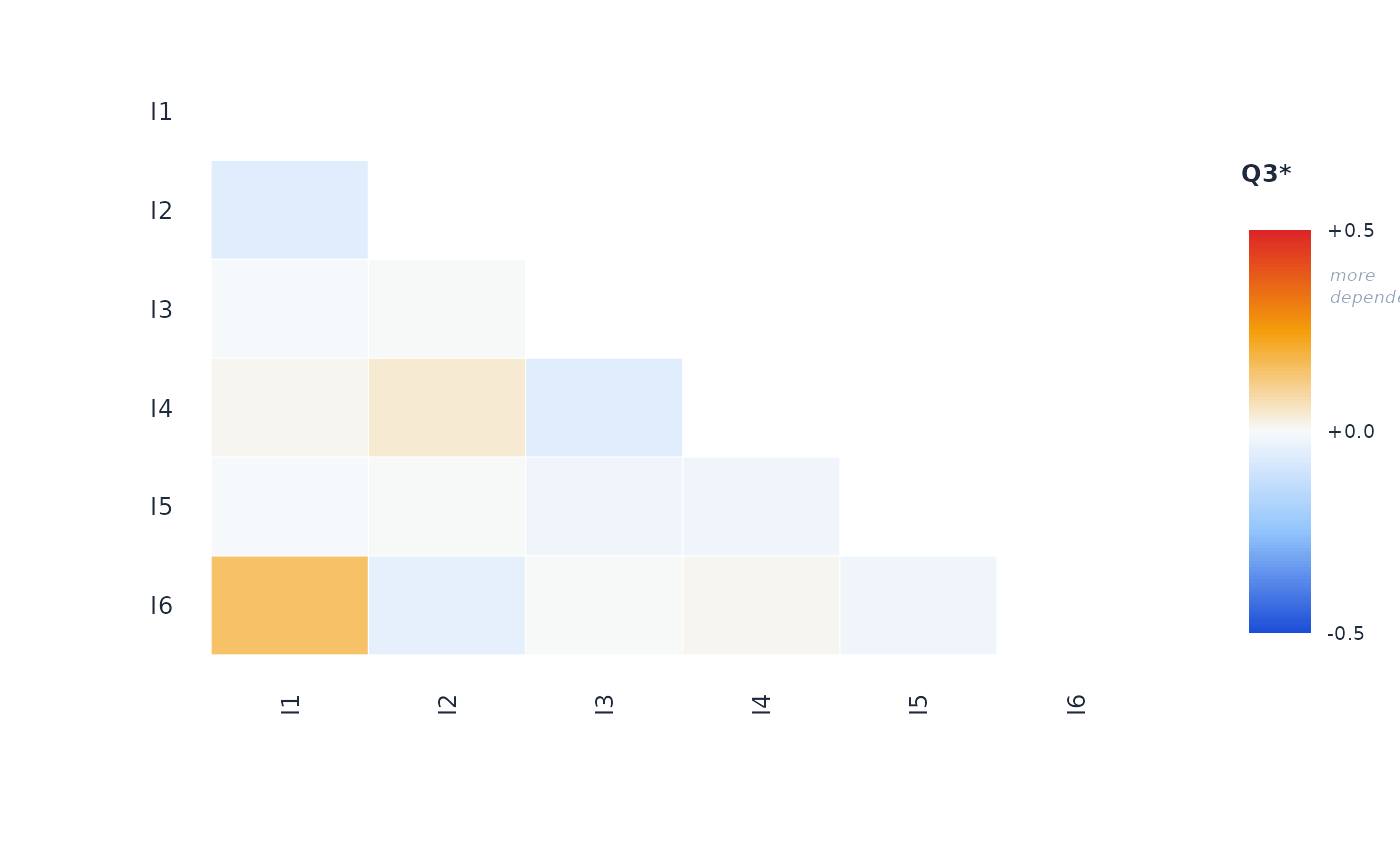
Only the lower triangle is drawn – the matrix is symmetric, so each pair
is shown once. With stat = "q3star" (the default) cells are coloured
by Q3* – each pair's residual correlation minus the average off-diagonal
correlation – so white marks the value expected under local independence
and warm colour marks dependence; with stat = "q3" the raw residual
correlation is coloured, white at zero. The scale saturates at cap
rather than the +/-1 of an ordinary correlation: a residual correlation
seldom reaches even 0.5 under a fitting model, so the colour is spent where
the values actually discriminate. A Q3* value of 0.2 is sometimes used as
a heuristic screen, but it is not a universal critical value (Christensen,
Makransky and Horton 2017).
Usage
plot_resid_cor(fit, stat = c("q3star", "q3"), cap = 0.5)Arguments
- fit
A fitted object from
rasch.- stat
Which statistic to colour:
"q3star"(adjusted Q3, the default) or"q3"(the raw residual correlation).- cap
Value at which the colour saturates (default 0.5).