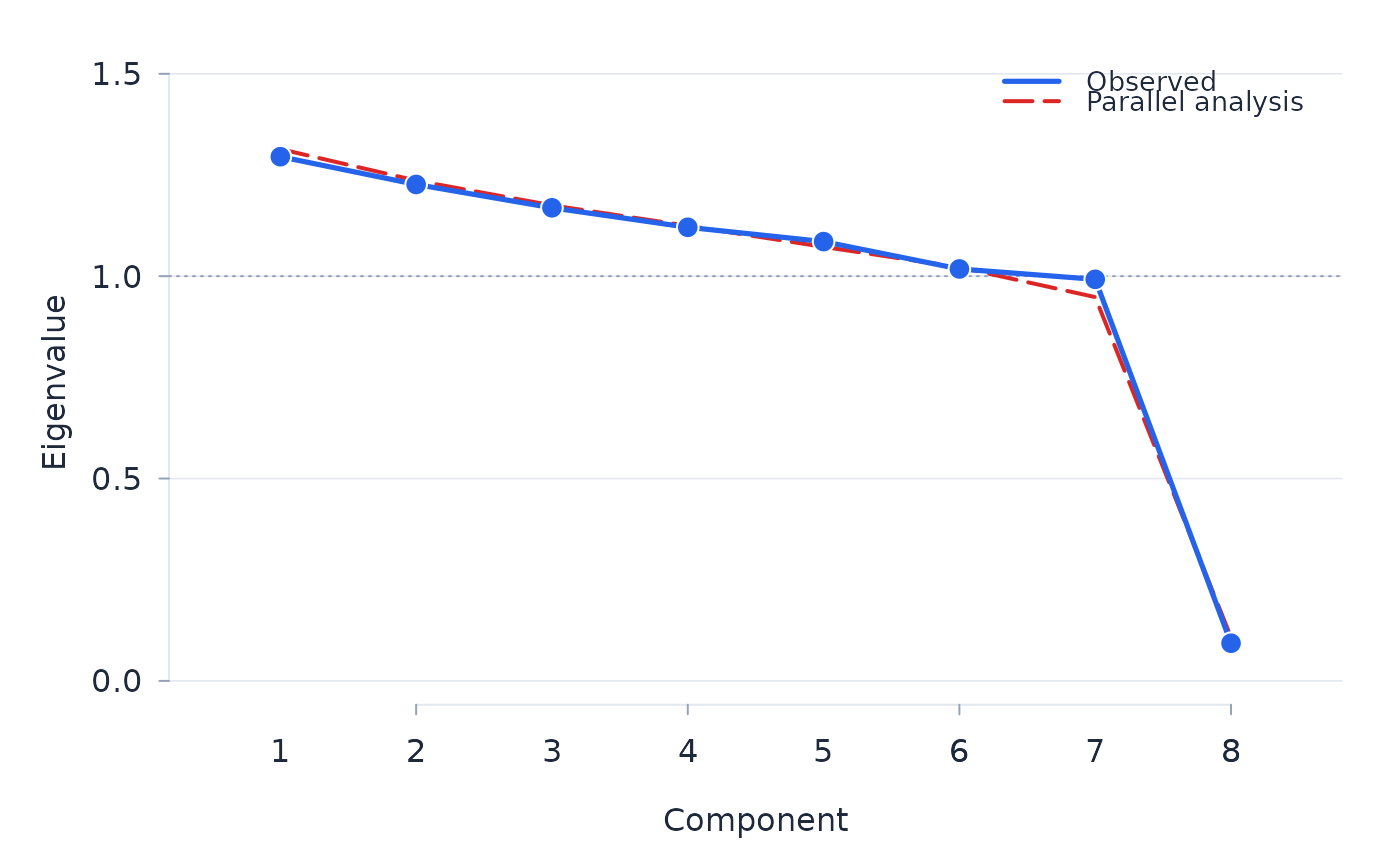
Scree plot of the residual components with parallel analysis
Source:R/dimensionality.R
plot_scree.RdEigenvalues of the residual correlation matrix for the leading components, with a model-simulated parallel-analysis reference: response patterns are drawn conditional on each person's observed score and missingness pattern, the item calibration and every person are re-estimated, and the residual eigenvalues recomputed. The plotted reference is a finite-simulation 5 familywise upper critical curve, obtained from the maximum standardised departure across the displayed components. Each simulated maximum is standardised against the other simulated draws so that it is comparable with the externally standardised observed value. The returned table also gives the reference mean, marginal upper-tail probability and single-step adjusted probability. Because estimating the person locations couples the residuals within a person, this reference sits above the classical random-normal one and is calibrated under the fitted model (Raiche 2005; Chou & Wang 2010). An observed eigenvalue above the critical reference has a familywise-adjusted simulated upper-tail probability at or below .05 and suggests structure beyond what the fitted model produces.
Arguments
- fit
A fitted object from
rasch. A simulated reference requires one response row per person; with repeated identifiers, useparallel = FALSEto display the observed eigenvalues alone. Fully anchored scoring fits also requireparallel = FALSE.- n_components
Number of leading components to display. The familywise adjustment covers these components.
- parallel
Draw the parallel-analysis reference band.
- reps
Model-simulated replicates for the reference; at least 20 when
parallel = TRUE. Larger values give a more stable upper-tail reference.- seed
Optional non-negative whole-number seed. The caller's random- number state is restored when the calculation finishes; see
rasch_rngfor generator support.- result
Optional result returned by an earlier call. Supplying it redraws that analysis without repeating the simulations.
Value
Called for its plotting side effect; invisibly the eigen table. With
parallel analysis it also contains reference_mean,
reference_critical, parallel_p, parallel_p_adj,
parallel_significant, and requested, usable, non-converged and
other-failure reference counts. The adjustment is
recorded in the table's parallel_adjustment attribute.
References
Raiche, G. (2005). Critical eigenvalue sizes (variances) in standardized residual principal components analysis. Rasch Measurement Transactions, 19(1), 1012.
Chou, Y.-T., & Wang, W.-C. (2010). Checking dimensionality in item response models with principal component analysis on standardized residuals. Educational and Psychological Measurement, 70(5), 717-731.
Westfall, P. H., & Young, S. S. (1993). Resampling-Based Multiple Testing: Examples and Methods for p-Value Adjustment. Wiley.