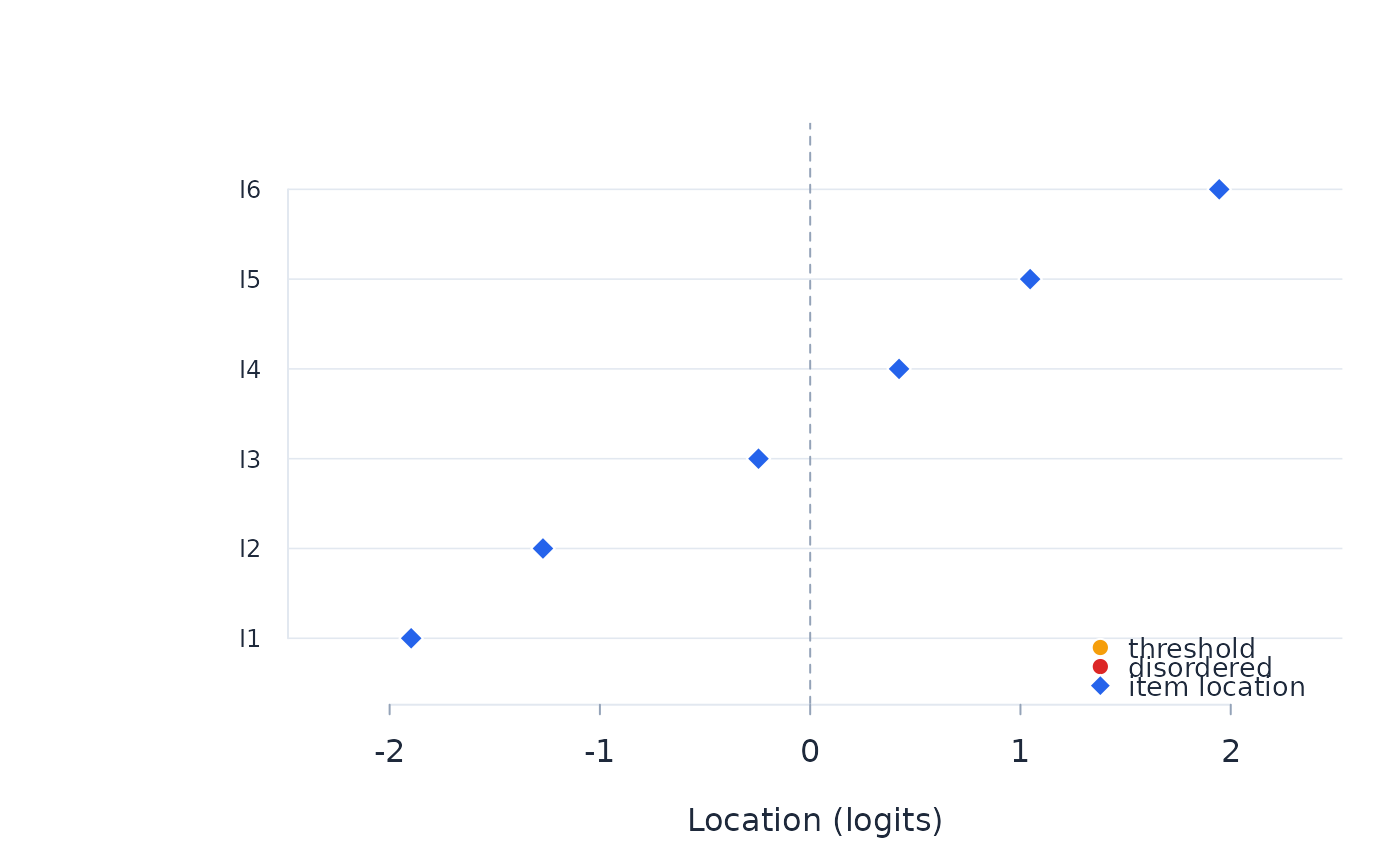
Each fitted column's threshold locations on a common logit scale, ordered by location, with disordered thresholds highlighted. The columns are response cells for MFRM and EFRM fits.
Arguments
- fit
A fitted object from
rasch.- order_by_location
Order items by their location (the default) rather than their original sequence.