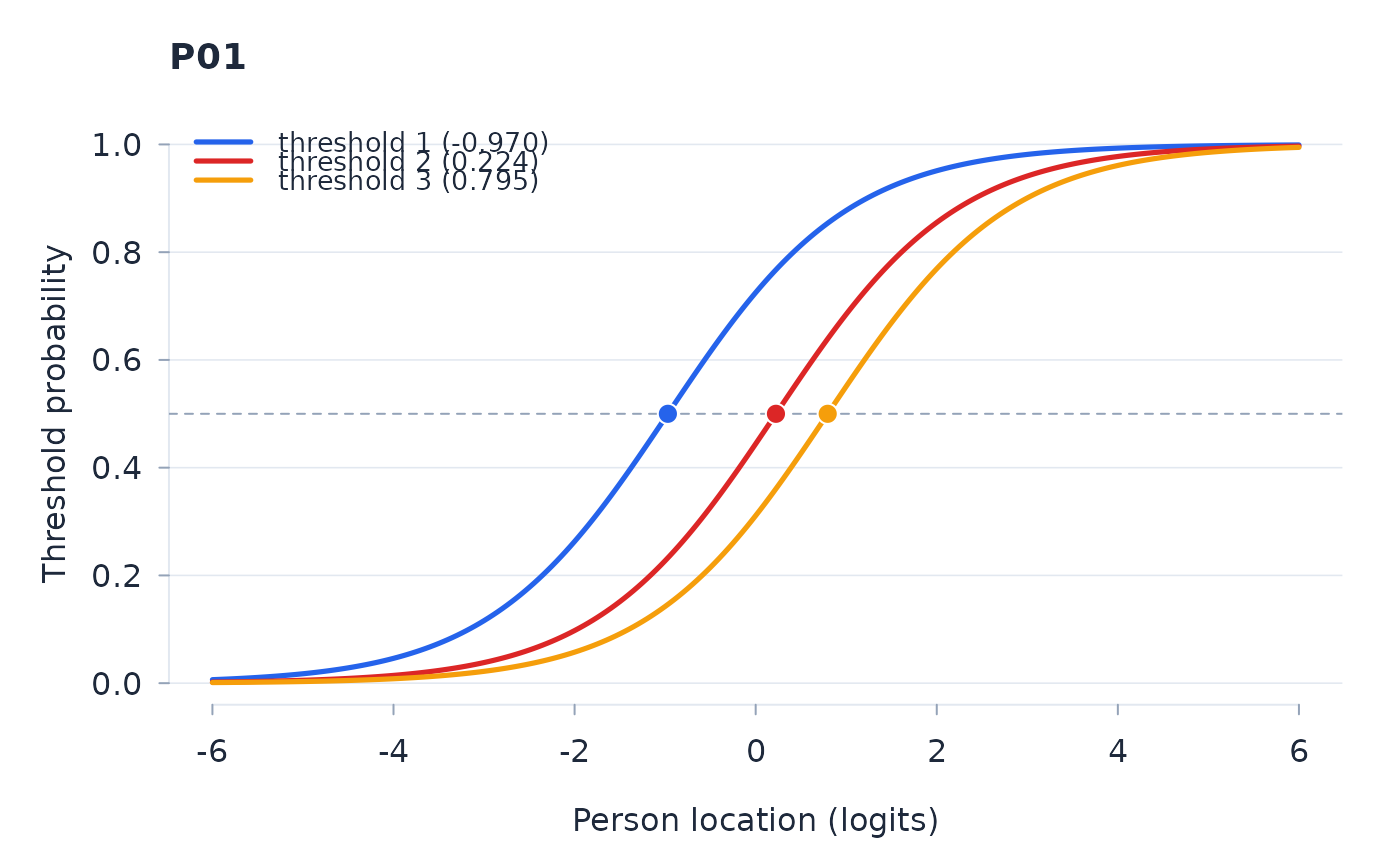
Conditional probability of success at each threshold,
P(X = k | X = k - 1 or k), a logistic ogive crossing 0.5 at the
threshold location. Disordered thresholds are immediately visible as
out-of-sequence ogives. With observed = TRUE the observed
conditional proportions per class interval are overlaid, the direct
check on whether each threshold discriminates (and hence whether
collapsing categories could ever be justified; Andrich and Marais 2019,
ch. 22).
Arguments
- fit
A fitted object from
rasch.- item
Item name or column index.
- grid
Logit grid over which to draw the curves.
- observed
Overlay the observed conditional threshold proportions per class interval.
- n_groups
Class intervals for the observed points; by default the fit's own allocation for this item, so the points match the item-trait test they illustrate.