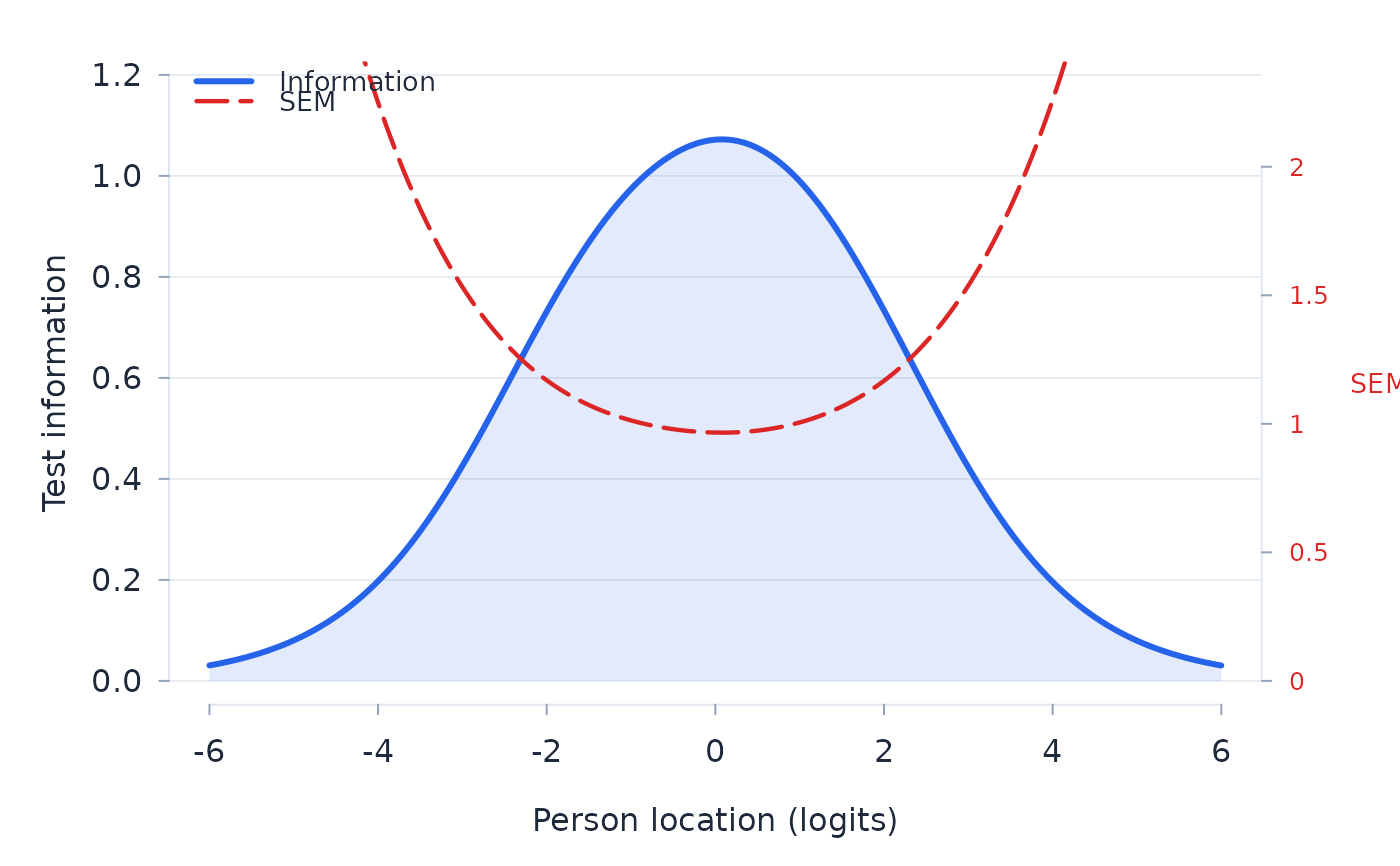
Test information across the logit scale with the standard error of measurement overlaid on a second axis.
Arguments
- fit
A fitted object from
rasch.- grid
Logit grid.
Test information across the logit scale with the standard error of measurement overlaid on a second axis.
A fitted object from rasch.
Logit grid.