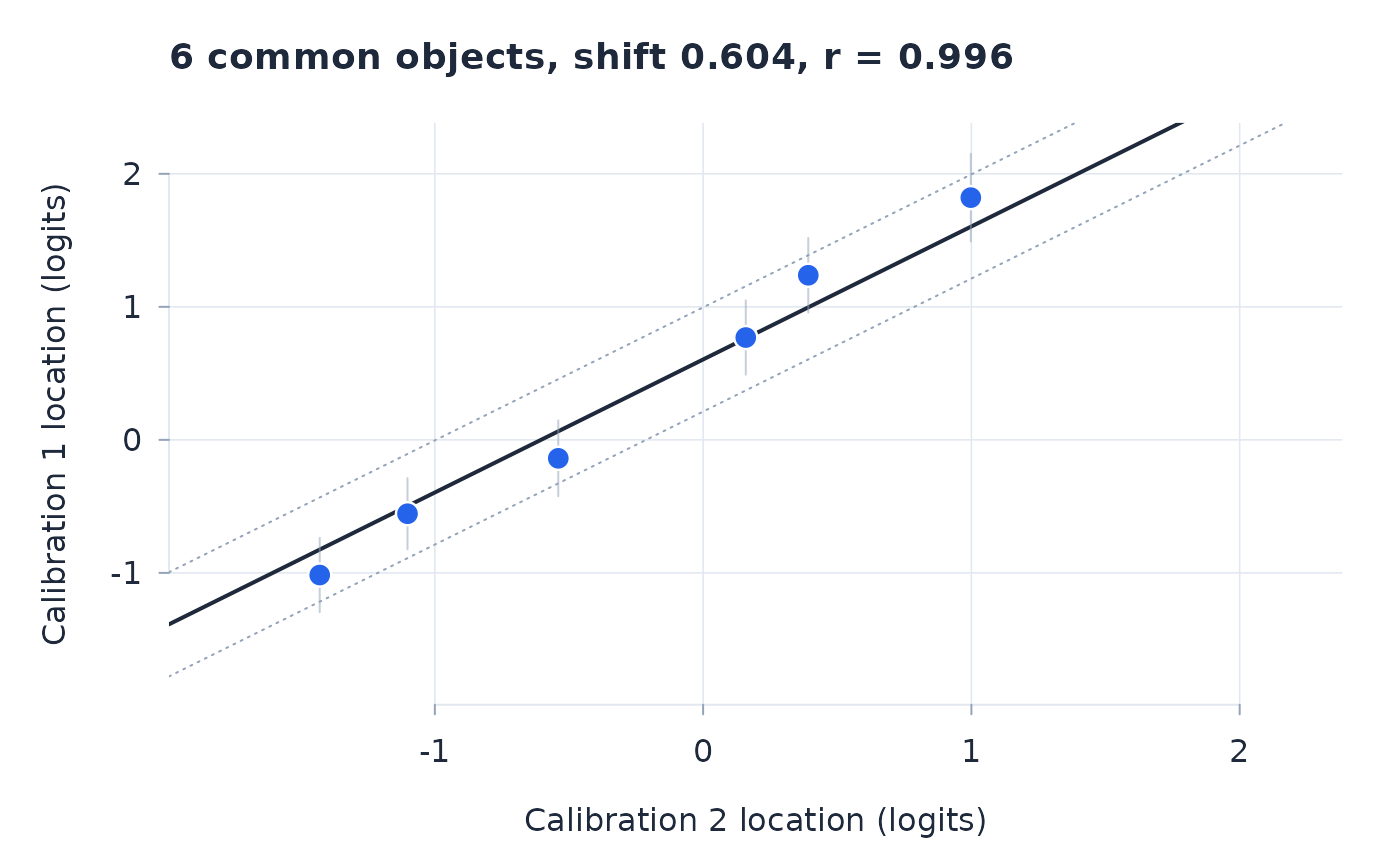
Scatter of the two calibrations' common-object locations with the shifted
identity line, per-object contrast intervals at the requested confidence
level, and a dotted guide band at their average half-width; objects that drift (after
the multiplicity adjustment) are highlighted and labelled. The counterpart
of plot_equate for Bradley-Terry-Luce scales.
Arguments
- fit1
A fitted object from
btl.- fit2
A second
btlfit, or a bank data frame with columnsobject,location, and optionallyse.- ...
Passed to
btl_equate(e.g.alpha,p_adjust).
Value
Called for its plotting side effect; invisibly the
btl_equate result.
Examples
set.seed(1)
beta <- setNames(seq(-2, 2, length.out = 8), paste0("O", 1:8))
sim <- function(objs) {
  pr <- t(utils::combn(objs, 2))
  d <- data.frame(a = rep(pr[, 1], each = 40), b = rep(pr[, 2], each = 40))
  d$win <- ifelse(runif(nrow(d)) < plogis(beta[d$a] - beta[d$b]), d$a, d$b)
  btl(d, "a", "b", "win")
}
plot_btl_equate(sim(paste0("O", 1:7)), sim(paste0("O", 2:8)),
                 independent = TRUE)