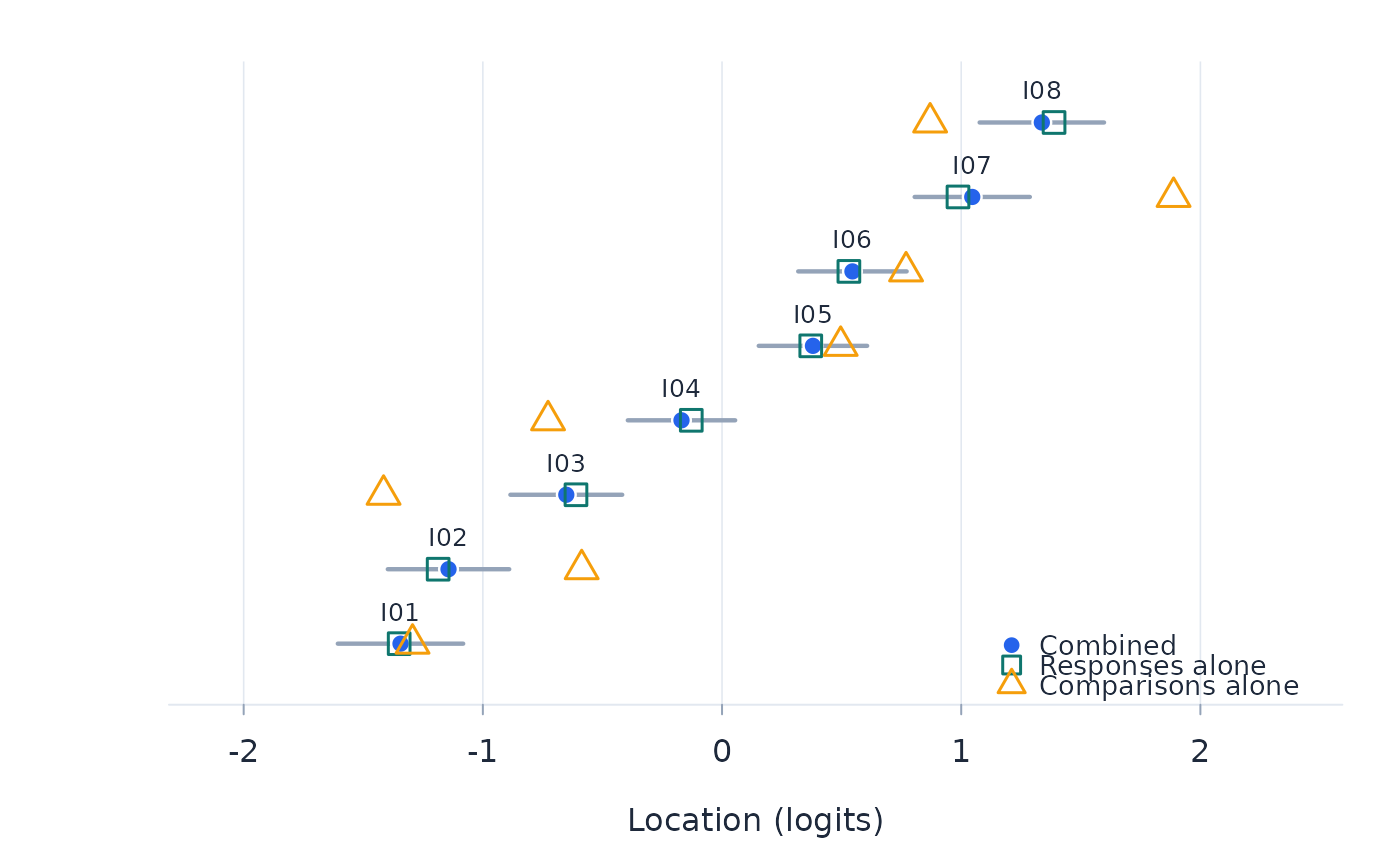
Caterpillar plot of the item locations from rasch_cj: the
combined location of each item with its 95 per cent interval, and beside
it the location each frame (the responses, the comparisons, the rankings,
or each test when several are linked) gives the item on its own, expressed
in the reference unit. Each connected block of a frame is shifted to
match the mean combined location of the objects it reaches. The markers
show relative placements, not differences between arbitrary origins. An item
is drawn in red when an item or threshold contrast in the invariance table
has a Holm-adjusted p below .05. A frame that does not
reach an item, or whose separate calibration did not converge, leaves no
marker for it.
Arguments
- fit
An item-mode object from
rasch_cj.- frames
Logical; draw the separate calibration of each frame beside the combined location (the default), or the combined locations alone.
Examples
set.seed(1)
delta <- seq(-1.5, 1.5, length.out = 8)
names(delta) <- sprintf("I%02d", 1:8)
theta <- rnorm(300)
X <- sapply(delta, function(d) as.integer(runif(300) < plogis(theta - d)))
pairs <- t(combn(names(delta), 2))[sample(28, 200, replace = TRUE), ]
p_a <- plogis(0.6 * (delta[pairs[, 1]] - delta[pairs[, 2]]))
cj <- data.frame(a = pairs[, 1], b = pairs[, 2],
                 winner = ifelse(runif(200) < p_a, pairs[, 1], pairs[, 2]))
fit <- rasch_cj(X, comparisons = cj, object_a = "a", object_b = "b",
                winner = "winner")
plot_cj(fit)